8. Create Axis, Gridlines, and Legend
To create an axis, use the axis method in the Scene class with two required parameters: visual channel and data field. Atlas support creating an axis for the “x”, “y”, “width”, “height” and “radialDistance” channels if these channels encode data values. In addition, an axis can be created for “x” and “y” channels if items are positioned using a grid layout. In the diverging bar chart example, rows of stacked bars, each representing an age group, are laid out in a grid, so we can create an axis for the “y” channel using scn.axis("y", "Age Group").
The appearance of an axis can be customized by setting its properties: orientation, x/y coordinate, stroke color, text color, tick offset, tick size, tick values, tick anchor, the visibility of ticks and path, label offset, label format, label rotation, and the rotation of the entire axis. Atlas tries to automatically determine an axis' position based on the axis' orientation, channel and the bounding box of the marks/collections in a scene. For example, an x-axis for a scatter plot with the “bottom” orientation is by default placed at the bounding box of the scatter plot. You can override this default by setting the axis' “y” property.
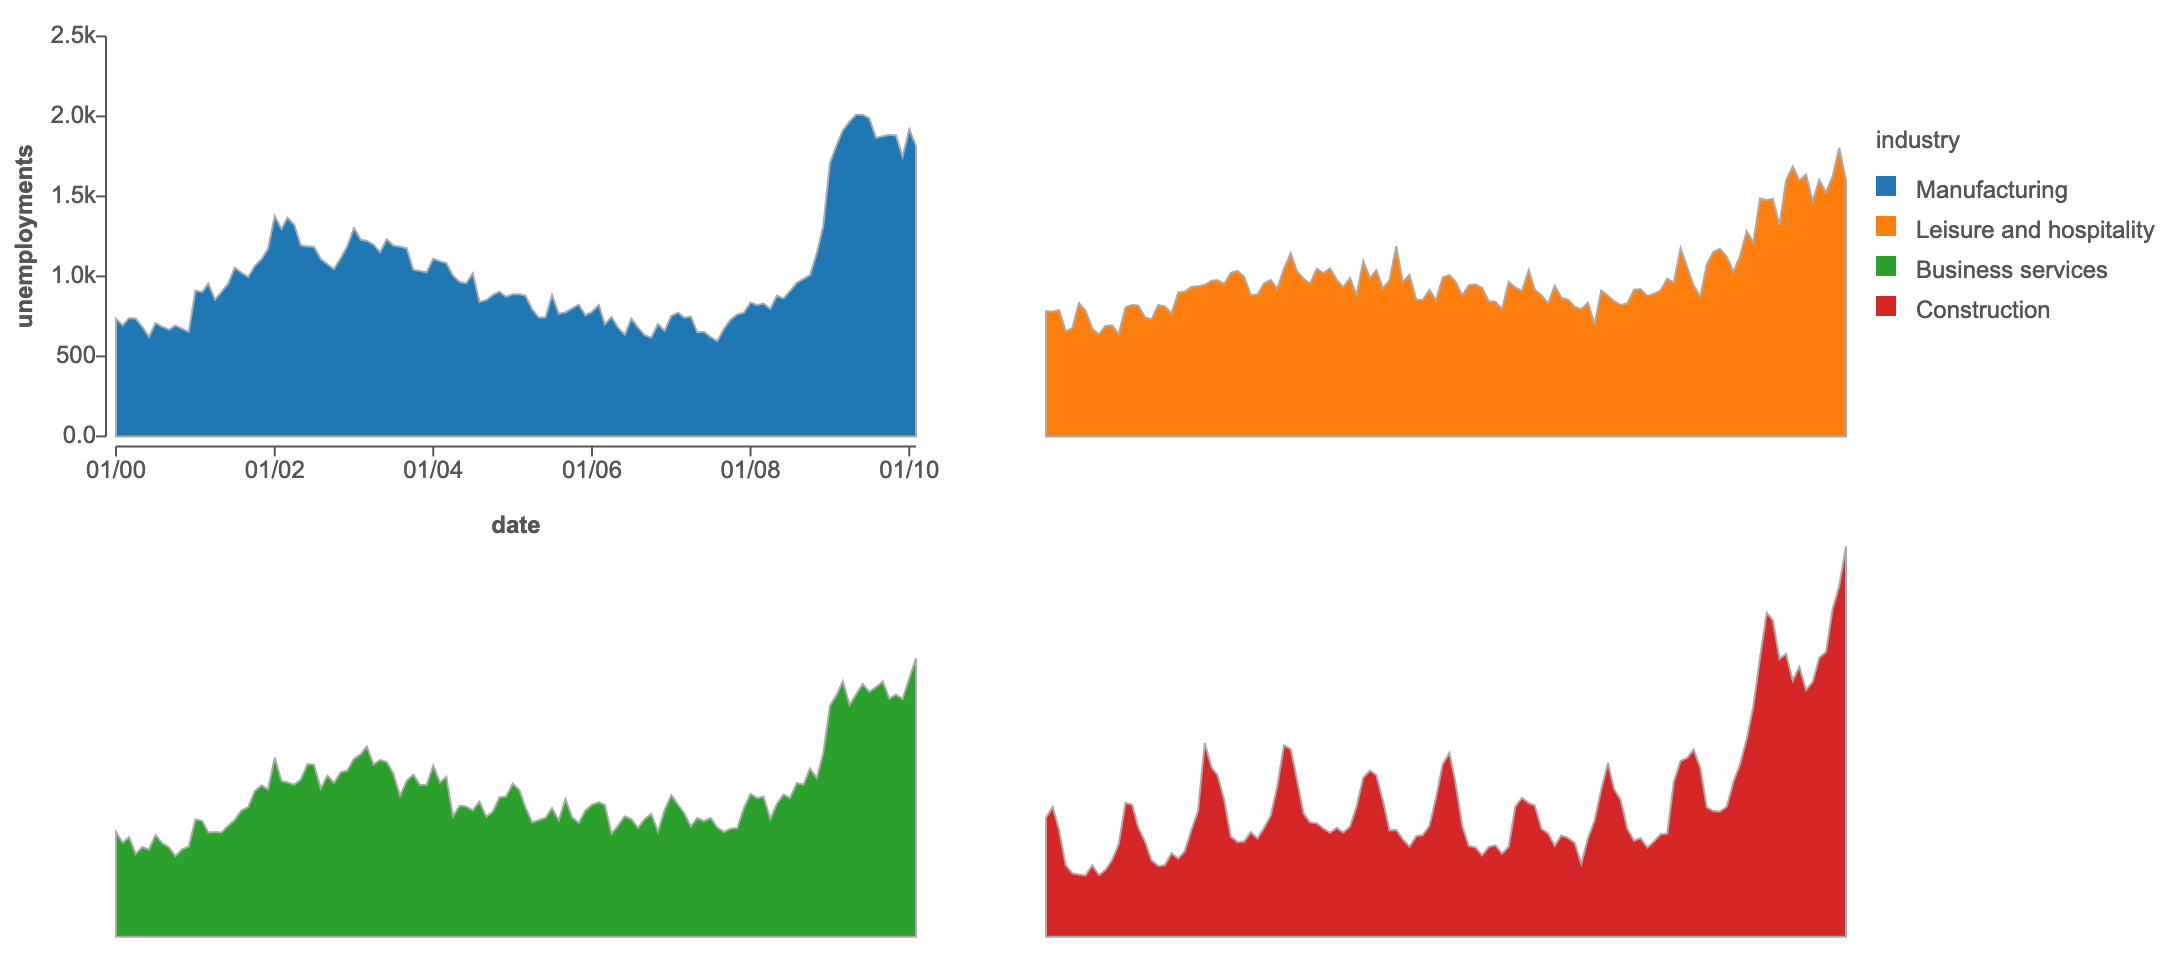
In the case of small multiples, by default, Atlas will create an axis for the first item in the collection. For example, in the figure below, we have multiple area charts in a collection laid out in a 2x2 grid. There is only one x-axis and one y-axis if we call scene.axis("x", "date", {orientation: "bottom", labelFormat: "%m/%y"}) and scene.axis("height", "unemployments", {orientation: "left", labelFormat: ".2s"}):
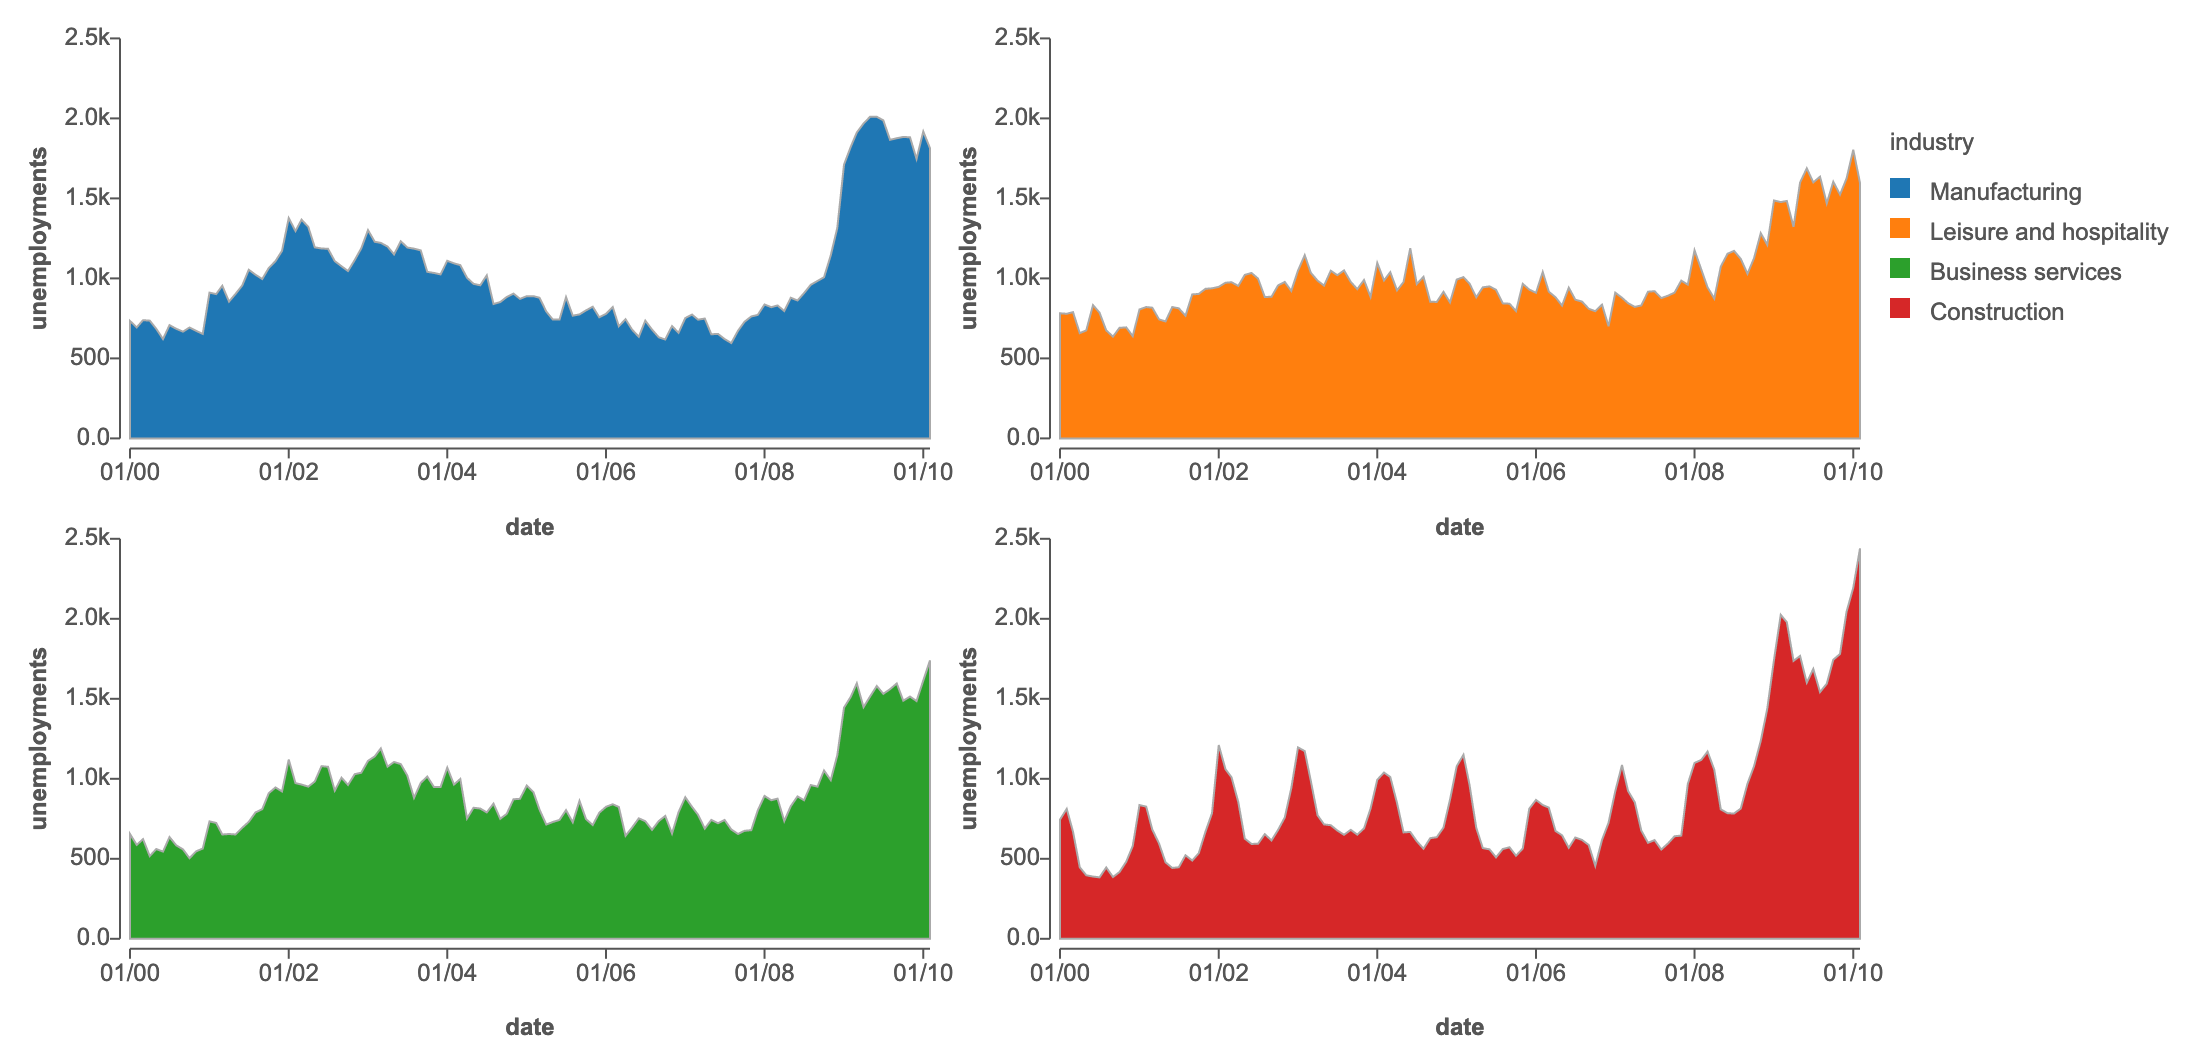
To add a set of axis for each area chart in the collection (assigned to a variable industries), we can pass the area as an item parameter:
for (let area of industries.children){
    scene.axis("x", "date", {orientation: "bottom", labelFormat: "%m/%y", item: area});
    scene.axis("height", "unemployments", {orientation: "left", labelFormat: ".2s", item: area});
}
which gives us the following visualization:
The item parameter must be the graphical object whose visual channel encodes the data field. For example, in a line graph, the item is a vertex, not a path.
By default, a title is automatically created for an axis if the positions of marks/collections along the axis are determined by a visual encoding (i.e., a field is specified). A title will not be created if the positions of marks/collections along the axis are determined by a layout. You can force the title to be shown by setting the showTitle parameter.
The creation of gridlines is simliar, we specify a visual channel and a data field when using the gridlines method in the Scene class. The appearance of gridlines can be customized by setting these properties: x/y coordinate, text color, stroke color, stroke width and values.
We can create a legend for color encodings involving the “fillColor” and “strokeColor” channels, using the legend method in the Scene class. For categorical color encoding, a legend consists of a title (the field name) and a set of color-value pairs. For sequential color encoding, a legend consists of a title (the field name), a rectangle showing the color gradient, and a set of values indicating the gradient stops. It is recommended that you set the position of a legend through its “x” and “y” properties.