1. Visualization Object Model
Every visualization created using Atlas can be described using the following object model:
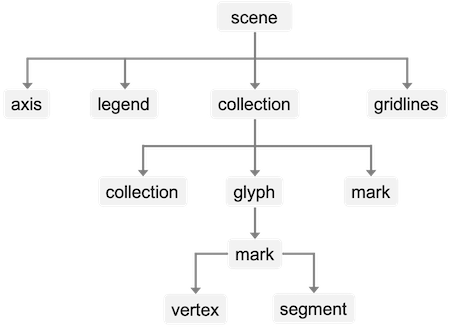
At the top level, we have a scene, acting as a container for all the visualization objects. In a scene, we typically have axes, legends, gridlines, and collections of items. A collection can be nested, e.g., the children of a collection are also collections. A collection consists of multiple marks or glyphs; where each glyph is essentially a group of marks. Finally, a mark is typically represented as a set of vertices, connected by line or curve segments. For example, a rectangle mark is composed of four vertices connected by four line segments.
In the diverging bar chart in Figure 1, we have three main components in the scene: a legend, an axis without ticks or path, and a collection of rectangle marks which forms the main chart area. Inside this collection nest four collections of bars, each collection representing an age group and consisting of four bars.
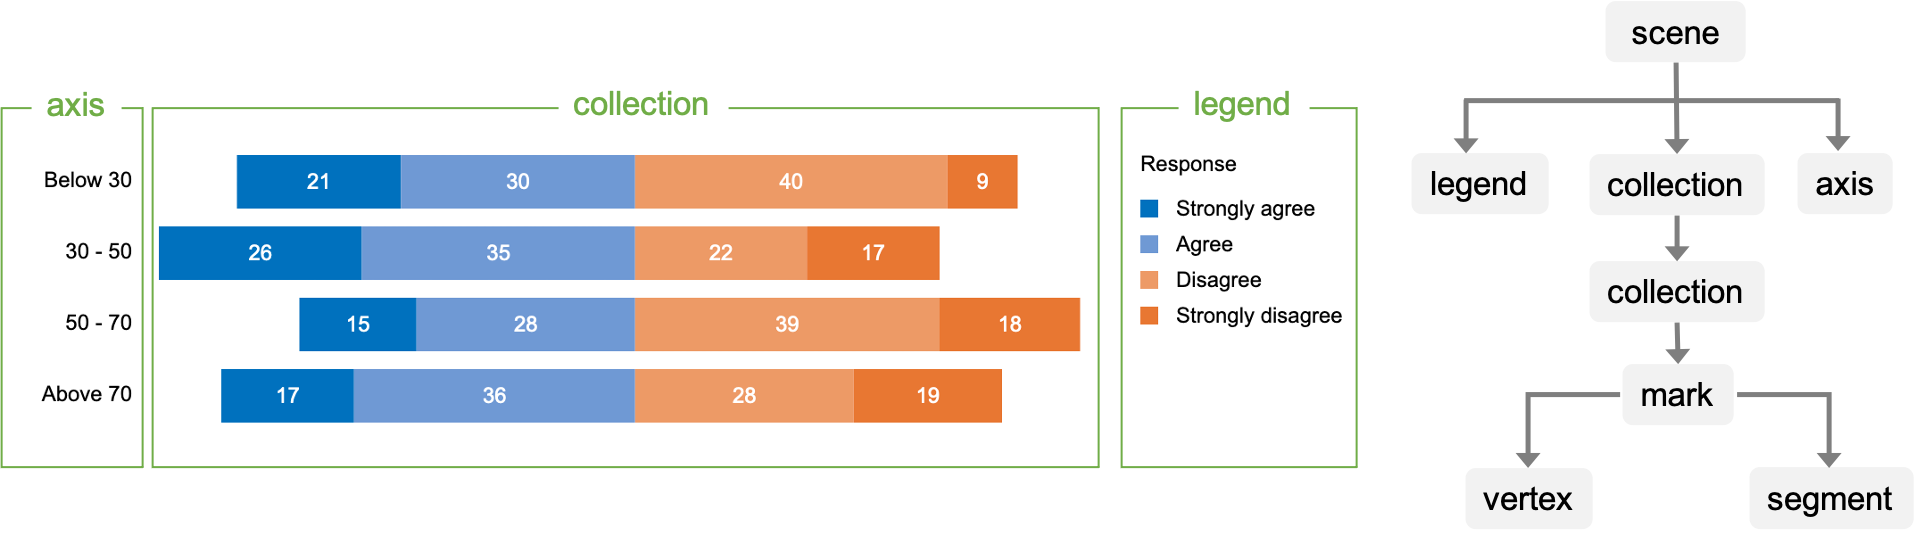
Figure 1: Visualization Object Model of a Diverging Bar Chart
In the box plot in Figure 2, we have two main components in the scene: an axis without ticks or path, and a collection of four box and whiskers glyphs. Inside each glyph, there are multiple primitive marks in the form of rectangle and lines.
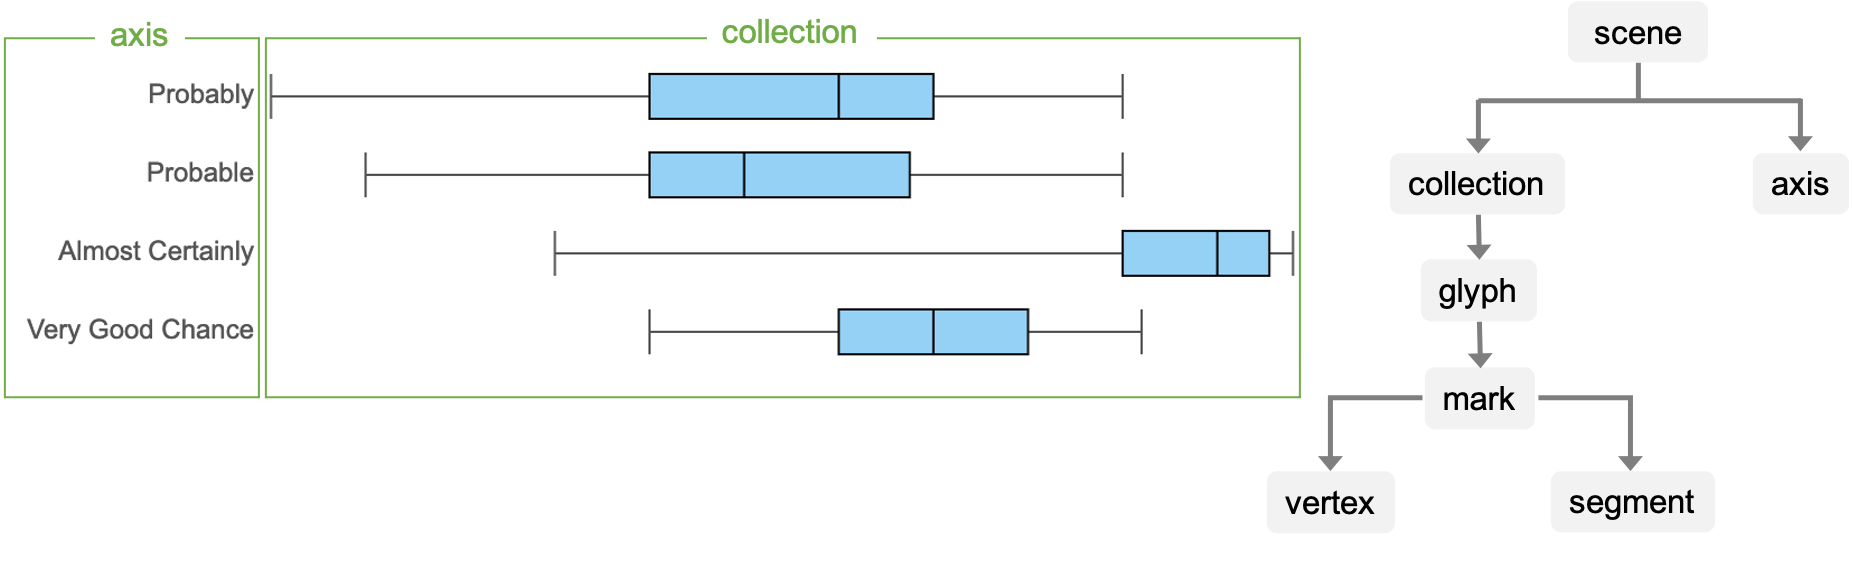
Figure 2: Visualization Object Model of a Box Plot